




Search
Related News
- 00
0000-00
What to verify before selecting a food engineering manufacturer - 00
0000-00
How to verify supplier production capacity in Southeast Asia - 00
0000-00
When should you hire an industrial project solutions contractor? - 00
0000-00
What to look for in wearable pet health technology for early illness alerts - 00
0000-00
When does packaging system scalability justify a larger initial investment?
Tags
Which packaging cost analytics metrics reveal avoidable line waste?




For a financial approver, the useful question is not whether a packaging line produces waste. Every line does. The question is whether the waste reflects an unavoidable cost of running the chosen format, material, and product mix, or whether it signals a controllable loss that is being absorbed into conversion cost.
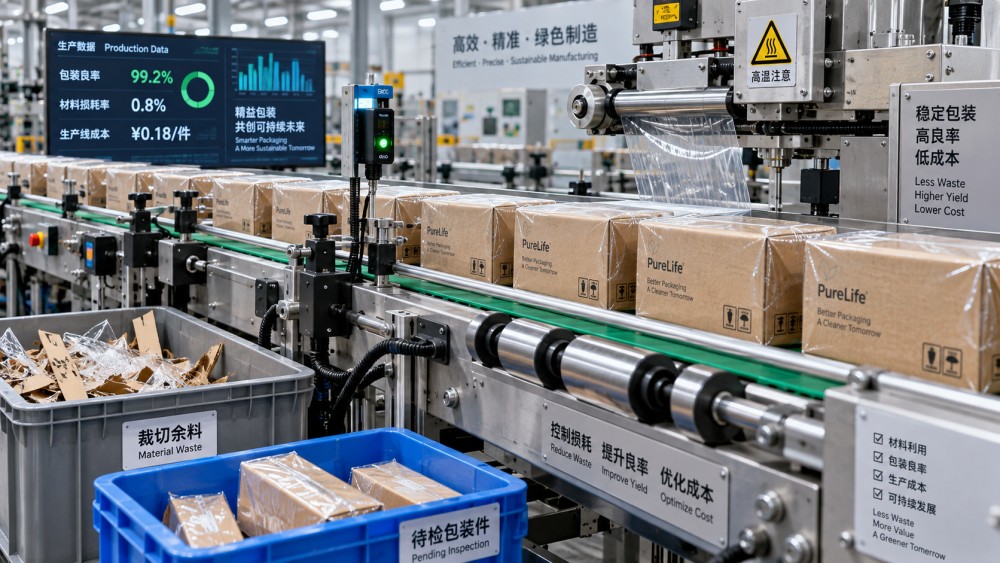
That distinction matters because packaging losses are often scattered across several accounts: material consumption, quality rejects, maintenance, labor overtime, production variance, and inventory adjustments. A line can appear to meet its output target while still consuming more film, board, labels, closures, or cartons than the approved cost model assumed. Packaging cost analytics becomes valuable when it reconnects those fragments to the finished units actually released for sale.
The most revealing metrics are usually not the ones that produce the largest percentage on a dashboard. They are the measures that expose a repeatable gap between planned material use and actual line behavior, then show whether that gap is tied to a machine, product format, shift, supplier lot, or changeover practice. Financial teams should look for a small group of linked metrics rather than approving action based on scrap volume alone.
Start with material variance per finished unit
Material variance is often the first signal, but it needs to be expressed in a way that supports a decision. Total packaging spend can rise for legitimate reasons: purchased material prices change, product volume grows, a pack-size mix shifts, or a business intentionally moves to a higher-specification format. Those changes do not automatically point to line waste.
A more useful measure compares the standard quantity of packaging material expected for each finished unit with the quantity actually issued, consumed, or written off, adjusted for verified inventory movements. The cost version of that measure translates excess use into currency per acceptable finished unit.
For example, a line may consume more flexible film than the bill of materials indicates. The excess could come from incorrect cut length, web breaks, poor tension control, start-up rejects, sealing failures, or unrecorded reel remnants. The aggregate variance tells finance that the cost model is leaking. Breaking it down by production order, pack format, material specification, and line shows where an intervention may pay back.
Material variance is especially important when packaging represents a meaningful share of unit economics or when materials are volatile in price. A small physical overconsumption rate can become material when applied across high-volume SKUs. It can also be masked by a favorable purchase-price variance: procurement may negotiate a lower material price while the plant uses more of that material per saleable unit. Both results can be true at once. Evaluating only purchase price can reward one function while leaving a larger conversion loss untouched.
There are limits. A standard material quantity must reflect the current approved design, not an outdated theoretical bill of materials. It should also account for normal start-up allowances where those are genuinely required. If standards are unrealistic, every line will look inefficient and the metric will lose credibility with operations.
Separate scrap rate from yield loss
Scrap rate is familiar, but on its own it can lead to weak conclusions. A low scrap percentage can coexist with a costly loss if the rejected material is expensive, if it occurs after value has been added, or if the calculation uses total material issued as the denominator. Conversely, a visibly high scrap rate during a short, planned commissioning phase may not justify a permanent capital response.
Financial approval is stronger when scrap is evaluated alongside packaging yield. Yield asks how much saleable output was obtained from the material and time consumed. It forces attention toward the denominator that matters: conforming finished units, rather than gross units started or total throughput.
A practical review should distinguish at least four categories:
- Start-up and shutdown waste: material and product lost while the line reaches stable operating conditions or is cleared at the end of a run.
- In-process rejects: packages rejected because of sealing, coding, fill-level, labeling, forming, or dimensional defects.
- Changeover losses: components discarded during a format, artwork, or product transition.
- Post-packaging loss: cases or packs rejected downstream after labor, product, and secondary packaging have already been added.
This classification changes the economics of the response. Waste occurring before a package is formed may justify a material-handling or machine-setting correction. Waste found at final inspection may indicate a more expensive problem because it includes embedded product, labor, energy, and previously applied packaging components. A single scrap percentage obscures that difference.
Finance should also ask whether scrap is recorded at the point where it occurs. Delayed recording can turn a recurring line defect into a month-end inventory discrepancy. That weakens accountability and makes trend analysis unreliable. A line that reports material use only after a production order closes cannot support rapid corrective action, even if its monthly cost report is technically accurate.
Measure changeover loss as a cost event, not just lost minutes
Changeover time is commonly monitored as an operational efficiency measure. For cost decisions, the more important question is what each changeover consumes and what it prevents the line from producing. A short changeover may still be expensive if it requires extensive disposal of printed packaging, partially used components, or product-contact materials. A longer changeover may be economically acceptable if it reduces purge loss and avoids avoidable quality rejects.
The relevant measure combines three elements: direct material discarded during the change, labor and overhead consumed while the line is unavailable, and the contribution or conversion value associated with lost production capacity. The final element must be used carefully. It should reflect a realistic opportunity cost, not an automatic assumption that every lost minute would have generated additional sales. Where demand, staffing, or downstream capacity is constrained, lost uptime does not always equal lost margin.
Changeover waste becomes particularly visible in environments with frequent SKU, pack-size, language, or promotional artwork changes. Financial approvers should test whether apparent “normal” loss is concentrated in a few formats. A format with a low annual volume but high clearance waste may carry a much higher true packaging cost than its procurement price suggests.
This is also where supplier and design decisions can intersect with operations. Minimum order quantities, roll widths, label formats, artwork changes, and component compatibility may all affect residual inventory and line clearance loss. The right response may be a revised production sequence, a different packaging specification, better component planning, or a line modification. Replacing a supplier without locating the loss mechanism can simply move the issue to another material code.
Downtime needs a waste link before it supports capital approval
Downtime is a high-visibility metric, yet it is easy to overstate its financial meaning. Not all downtime causes packaging waste, and not all material waste occurs during recorded downtime. A jam may create a short stoppage with little disposal. Repeated web breaks, misfeeds, sealing faults, or print-registration failures can generate both downtime and significant material loss.
For approval purposes, downtime should be segmented by cause and paired with the associated reject or overconsumption record. The strongest cases are patterns such as:
- recurrent stoppages tied to a specific packaging substrate or component dimension;
- high reject quantities immediately following a known machine alarm or restart;
- one line showing materially worse yield than comparable lines using the same specification;
- defect-related downtime that rises after a particular speed, format, or product change;
- frequent minor stops that individually appear insignificant but collectively drive excess material use.
This link matters because an equipment proposal should solve a defined loss mechanism. “The line has too much downtime” is usually insufficient evidence for a capital request. “A recurring feeder issue produces a measurable volume of damaged cartons, extends recovery time after stops, and raises cost per released case on designated formats” creates a testable investment case.
It also protects finance from approving automation that improves a headline availability figure without reducing the loss that matters. A faster line can increase waste if controls, inspection capability, or material handling do not keep pace. Capacity and yield should be reviewed together.
Use cost per good unit to reconcile competing stories
Cost per finished unit is the metric that brings material variance, scrap, changeovers, and downtime into one decision frame. It should include the packaging material actually consumed, direct conversion costs relevant to the line, and the cost of quality losses where those losses are attributable to packaging operations. It should be calculated against accepted output, not planned output or units initiated.
Its value lies in comparison. Finance can compare the same SKU across periods, lines, shifts, or suppliers, provided the calculation uses consistent scope and allocation rules. It can also compare formats that have very different nominal material prices. A lower-cost package may be more expensive to run if it creates frequent stops, poor yield, or higher rejection rates.
Still, cost per good unit should not become a blunt scorecard. Product complexity, run length, planned maintenance, seasonal demand, and pack architecture can legitimately change the result. The financial review should therefore combine the measure with a small number of operating drivers: run size, line speed, changeover count, material specification, and reason-coded waste.
Without those drivers, a manager may improve the metric by avoiding difficult SKUs, extending runs beyond demand needs, or shifting production to another line. That may make one report look better while increasing inventory, obsolescence, or cost elsewhere.
Look for concentration before funding a response
Avoidable waste rarely has a uniform pattern. It is often concentrated in a limited number of SKUs, materials, machines, operators’ handover periods, or production conditions. A useful financial analysis therefore ranks losses by total annualized cost and by repeatability.
A high-cost, recurring loss on a stable high-volume format is often a stronger candidate for equipment modification, controls improvement, or supplier action than a larger percentage loss on an infrequent, unstable run. Equally, a modest but widespread loss across several lines may justify a standard-setting, training, or data-capture initiative rather than separate capital projects.
Before approving expenditure, require a baseline that makes the proposed benefit auditable. The baseline should define the time period, product mix, material price basis, accepted-output denominator, normal operating allowance, and waste categories included. It should also identify whether the proposed project is expected to reduce material use, rejects, downtime, labor, or all of them.
The proposal should state how the result will be measured after implementation. If the expected gain is lower scrap, the measurement cannot rely only on total spend, because purchasing prices and production volume may change. If the expected gain is fewer changeover losses, the review should capture both disposal quantities and changeover frequency. A credible project leaves little room for a favorable result to be created by a change in reporting scope.
Warning signs in a packaging cost report
Several reporting practices make avoidable line waste difficult to see. Material costs may be averaged over a month despite substantial price changes or mix shifts. Scrap may be reported as a single plant total, preventing comparison across lines and formats. Waste codes may be broad enough that recurring technical faults disappear into a generic “other” category. Inventory adjustments may be used to close production orders without being traced back to a physical cause.
Another warning sign is a cost model that treats all waste as an operations issue. Packaging losses can originate in specification choices, supplier consistency, artwork control, planning discipline, maintenance condition, and quality inspection design. Financial governance should not dilute ownership, but it should avoid assigning the entire loss to the last department that touched the material.
The best packaging cost analytics does not seek a perfect number before action is possible. It creates enough consistency to separate normal process allowances from recurring economic loss, then directs attention to the few causes that can be corrected. For a financial approver, that is the point of the exercise: fund improvements where the evidence connects a visible operating condition to a durable reduction in cost per saleable unit.
Related News
- When does packaging system scalability justify a larger initial investment?Sep 20, 2026Packaging system scalability: discover when a higher upfront investment reduces future downtime, supports growth, adds format flexibility, and protects long-term profitability.
- Which packaging cost analytics metrics reveal avoidable line waste?Sep 20, 2026Packaging cost analytics reveals avoidable line waste through material variance, yield loss, changeover costs, downtime links, and cost per good unit—helping finance prioritize high-return improvements.
- How to assess a food packaging technology manufacturer’s line integration capabilitySep 14, 2026Learn how to assess a food packaging technology manufacturer’s line integration capability, from throughput and controls to hygiene, testing, and support.
- What Is the Difference Between Recycled and Renewable Packaging Materials?Sep 11, 2026What is the difference between recycled and renewable packaging materials? Explore feedstocks, recyclability, performance, and smarter sourcing choices.